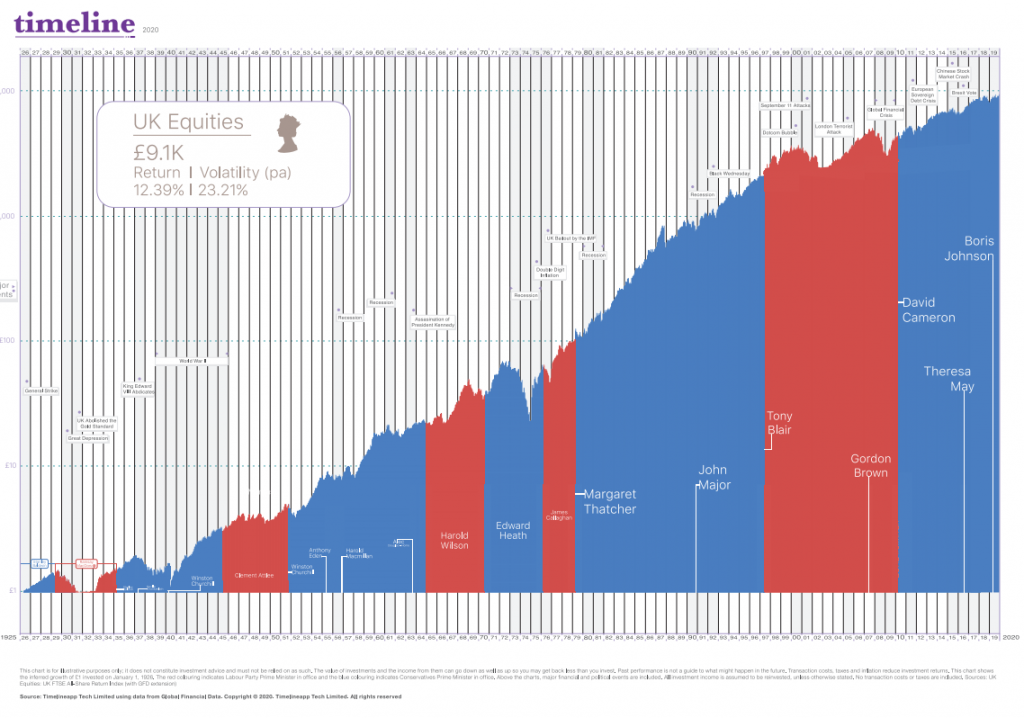
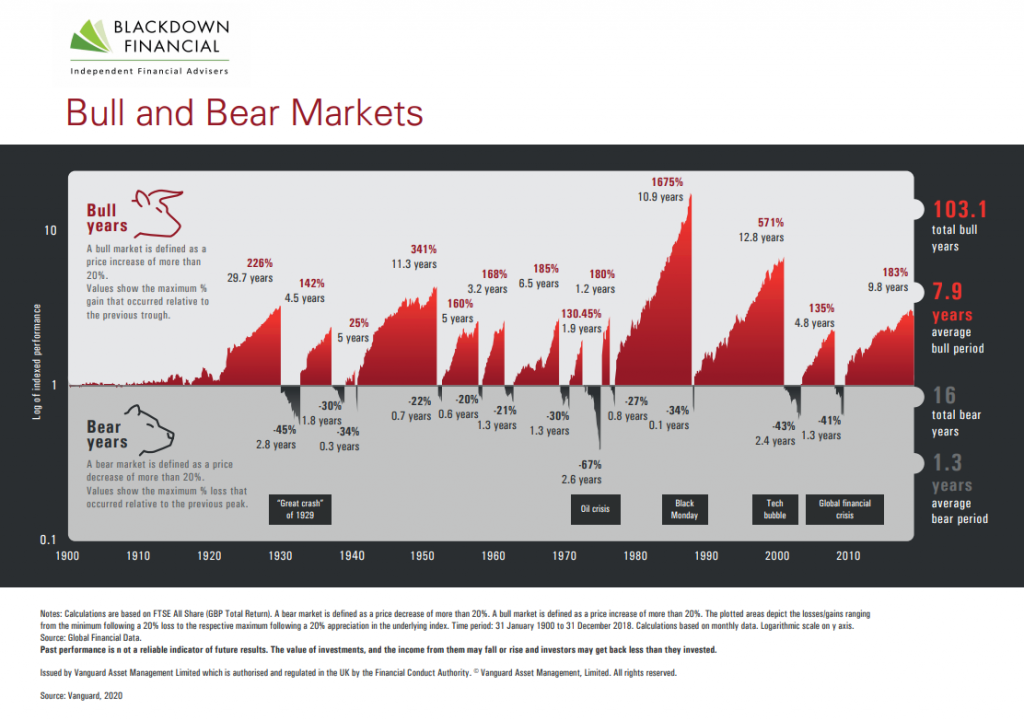
| A Bull market is defined as a price increase of more than 20% and a Bear market a decrease of more than 20%. It is good to use the phrase “to grin and bear it” to remember that the Bear market is the falling one. So how common are these Bulls and Bears? There have been 12 since the 1930’s so on average every 7 1/2 years. This would means the long term investor will probably experience a number of these during their investing lifetime. The graph above, complements of our key investment partners Vanguard, shows the UK market but similar patterns exist in other major stock markets as major Bear markets tend to affect markets globally and each crisis is different. To look at this another way, below is the growth of £1 since 1925, with the colours representing which political party was in power at the time. This graph illustrates why you would hear us talk about the permanent uptrend with temporary declines. |

Significant temporary declines are very unpleasant as they are accompanied by some global event such as this Covid-19 pandemic, the Financial Crisis, the “Tech Wreck”, the Oil Crisis, etc, but as one client said this week, “it’s like negative equity on a house when the investment fall in value, as in it’s a not an issue unless you plan to move and why would you if you did not need to“ – wise words
Contact Blackdown Financial on 01823 321616 or email enquiries@blackdownfinancial.co.uk #AskBlackdown


